

|
Internet Software & Data Management
|
Software Examples:
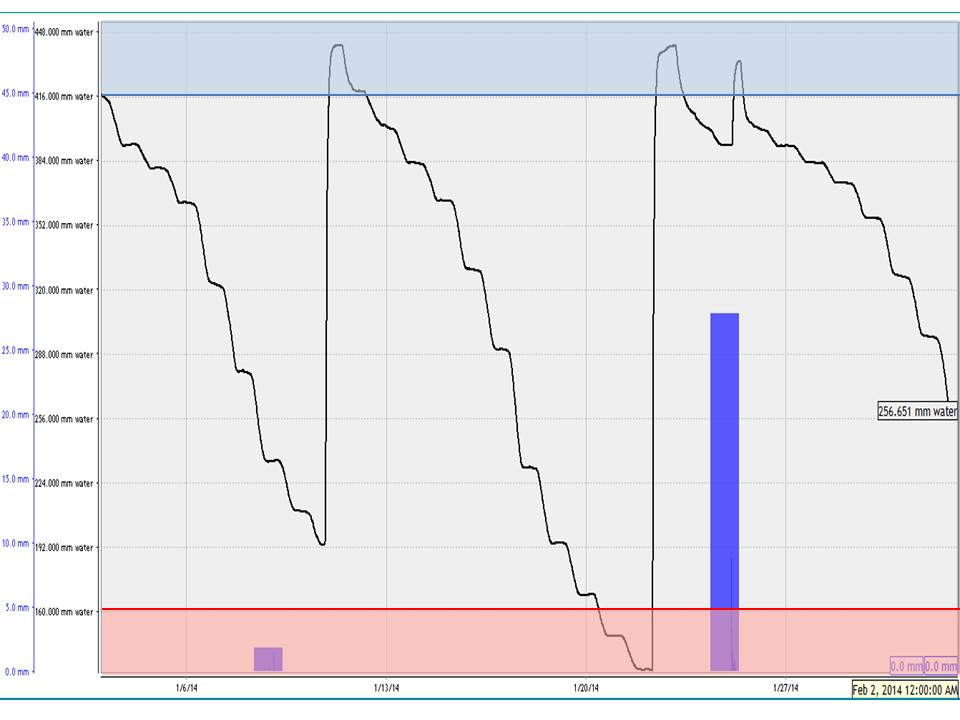

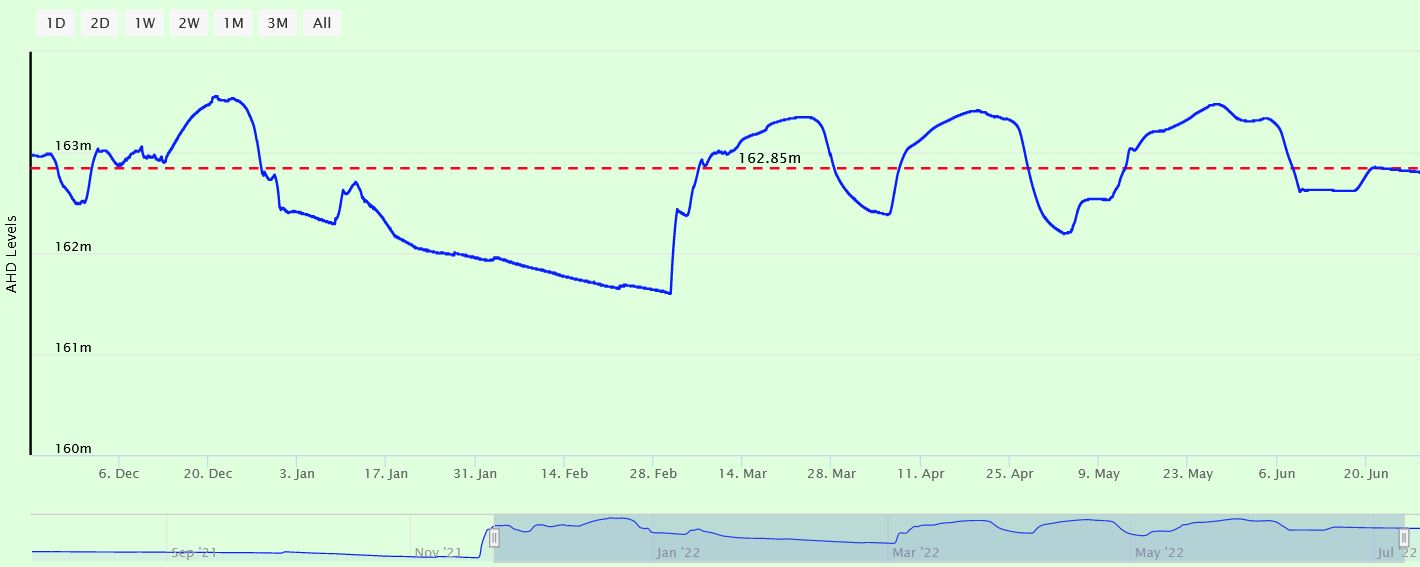
Soil Moisture Probe Data - what's it really telling me....?
- Below are screen captures of soil moisture data are from various brands of soil moisture probes.
- This information is an example only and an indication of the type of data that can be generated from a soil moisture sensor
- This data should not be used as a direct reference to other individual sites.
- The data displayed below is technical interpretation of the sensor data generated from that individual site
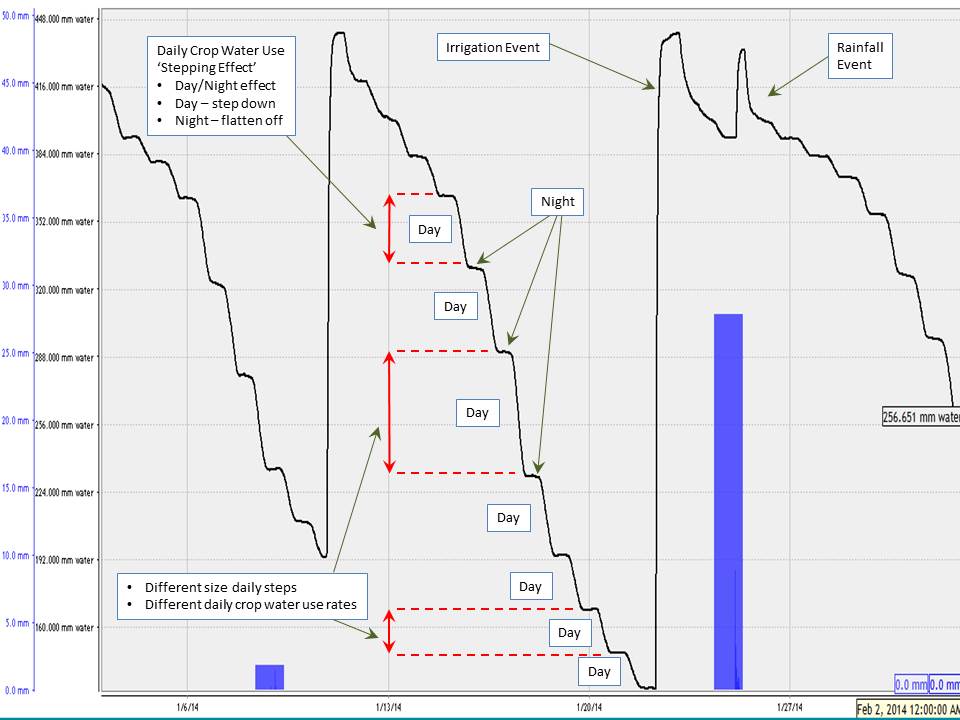
Daily Crop Water Use
|
Example Data - Daily Crop Water Use
|
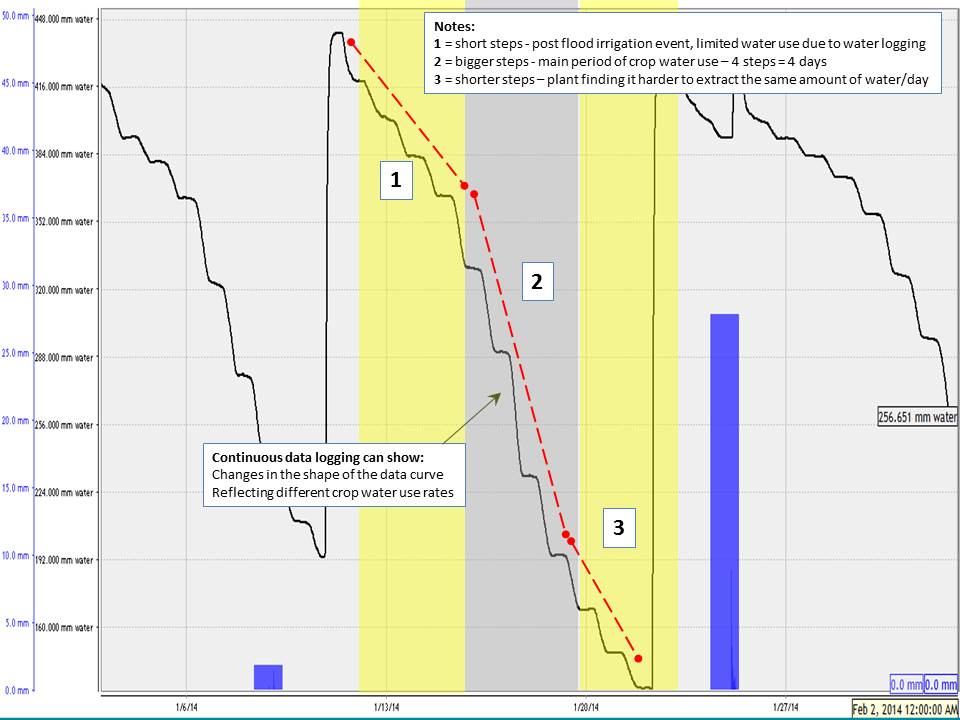
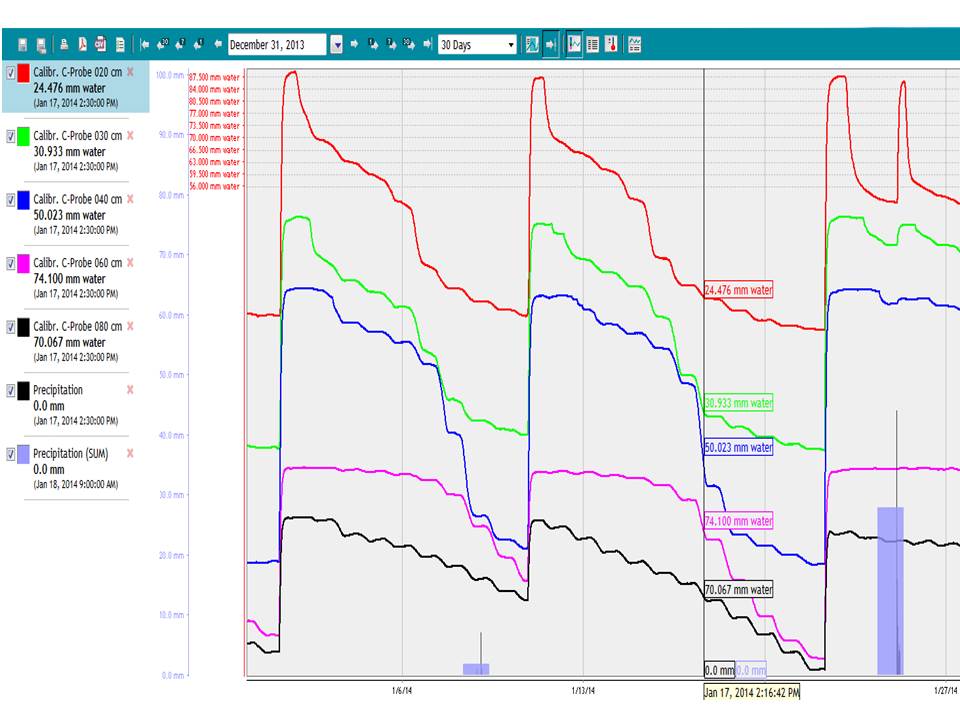
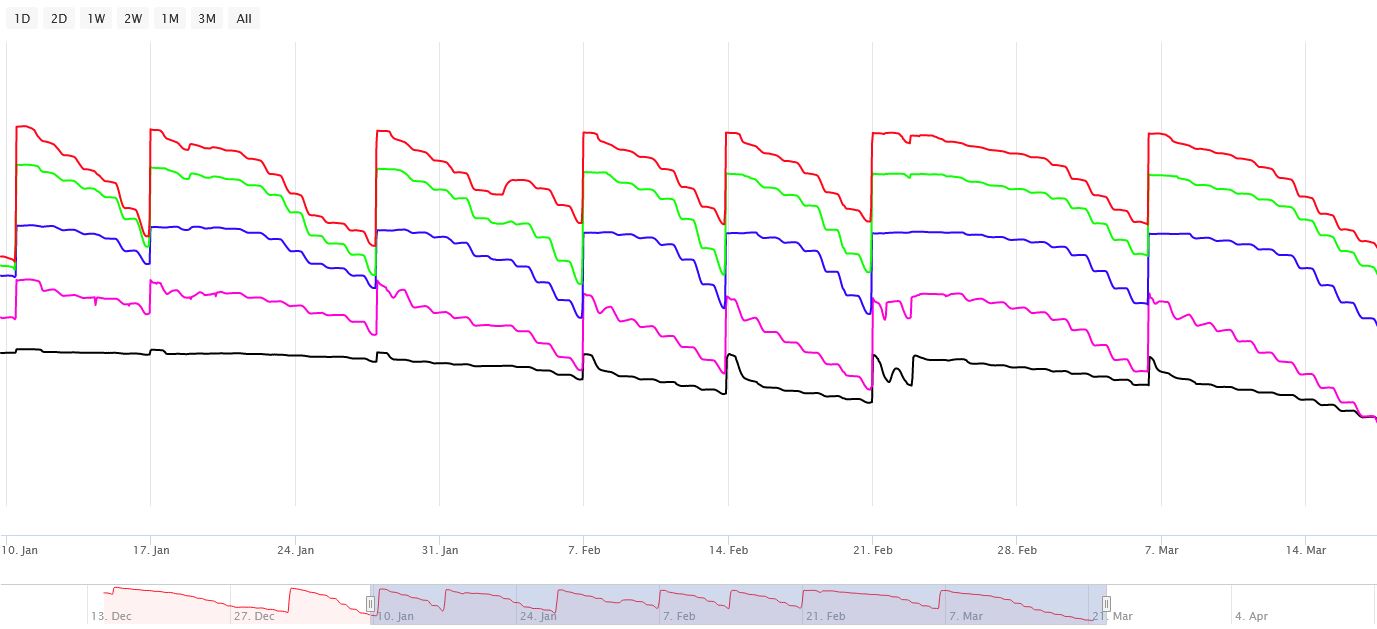
Data Curves & Trend Lines
|
Example Data - Data Curves & Trend Lines
|
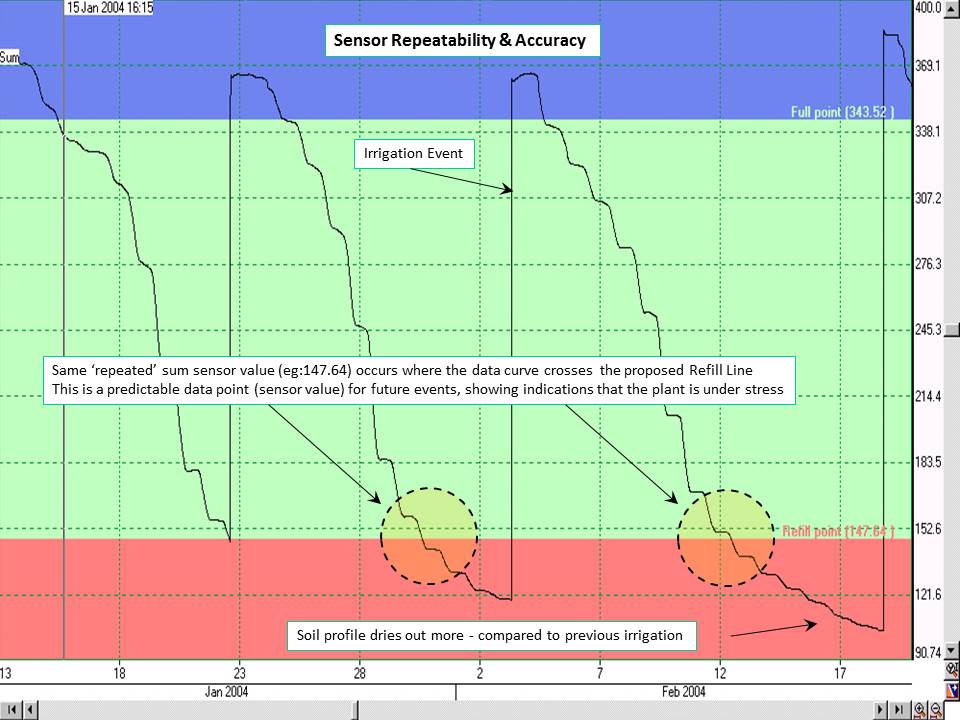
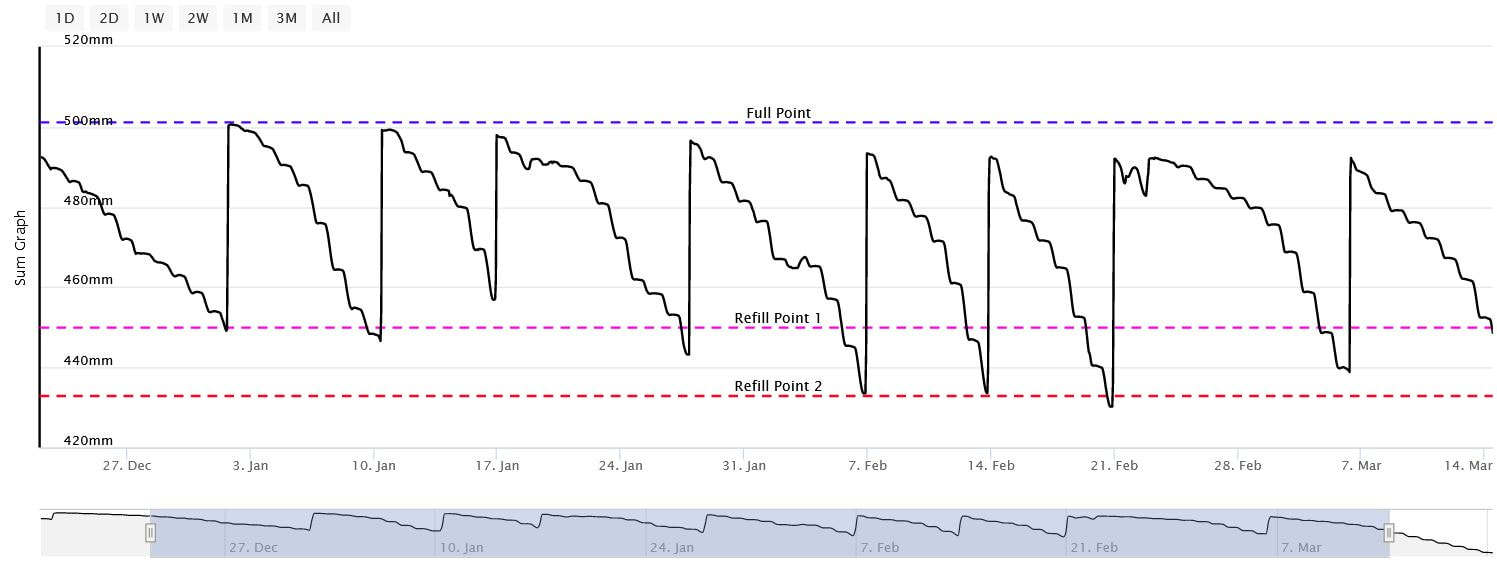
Sensor Repeatability Points
|
Example Data - Sensor Repeatability Points
|
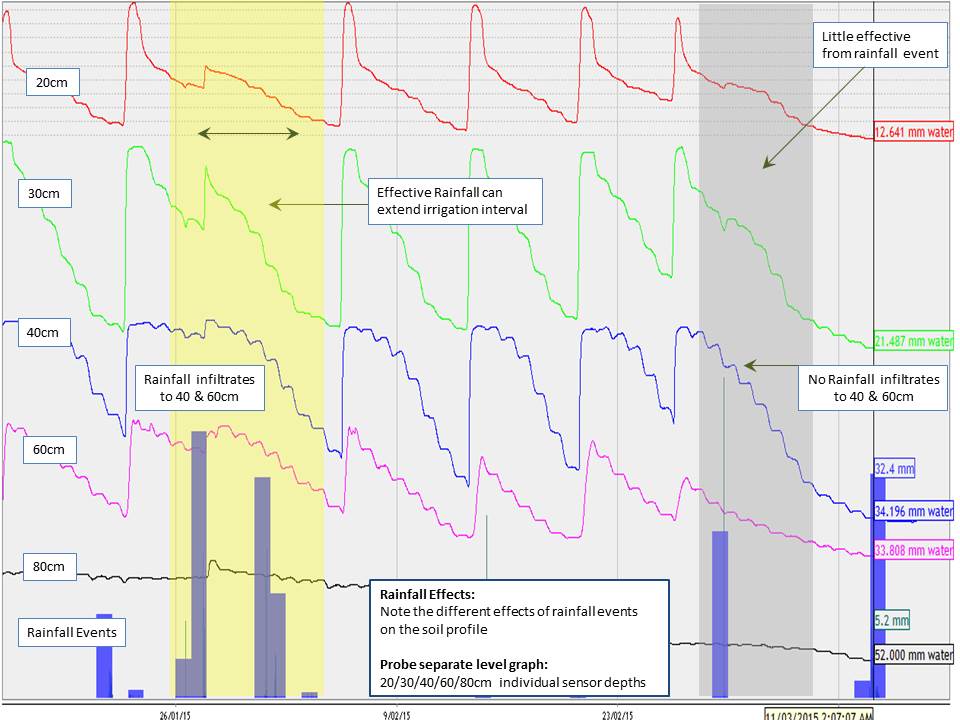
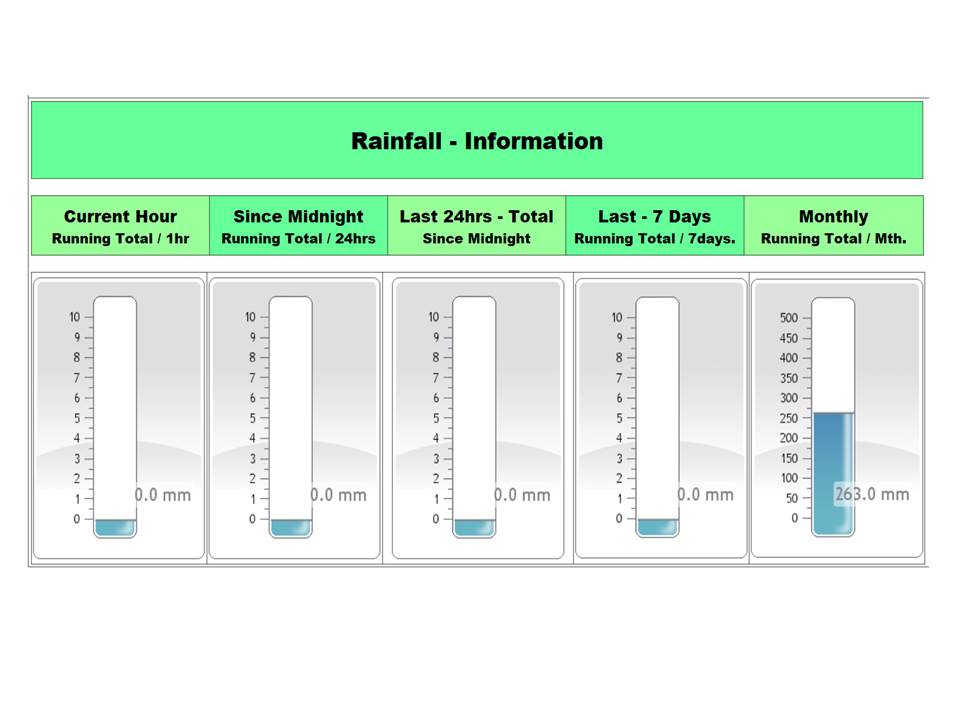
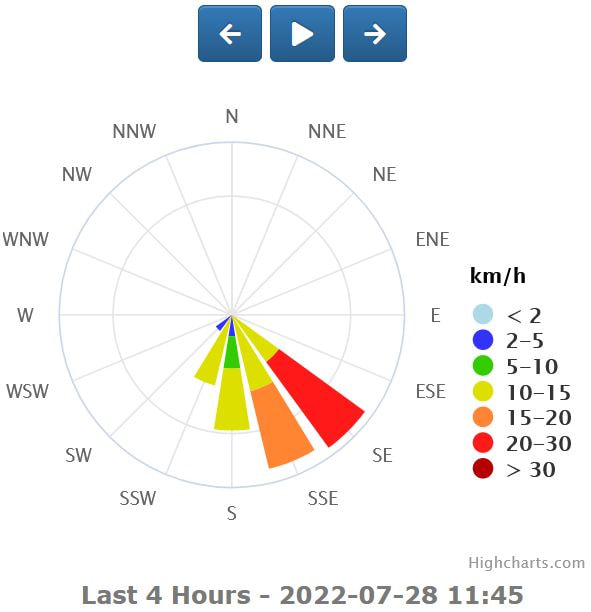
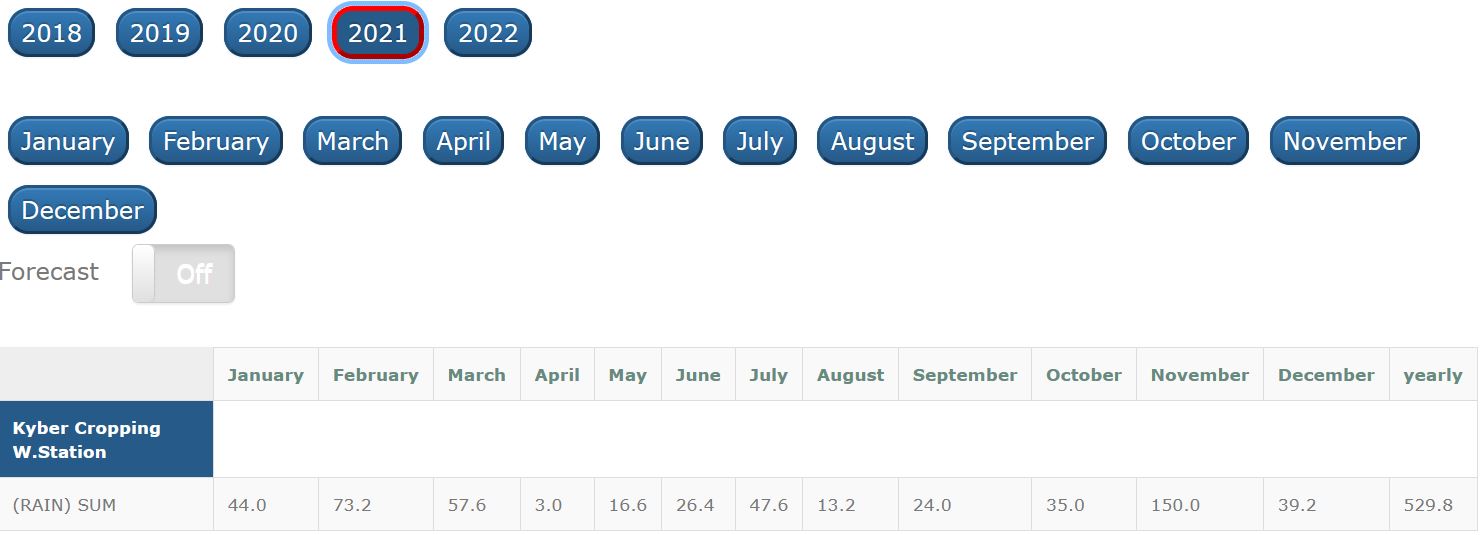
Irrigation Events & Rainfall
|
Example Data - Irrigation Events and Rainfall Infiltration
|
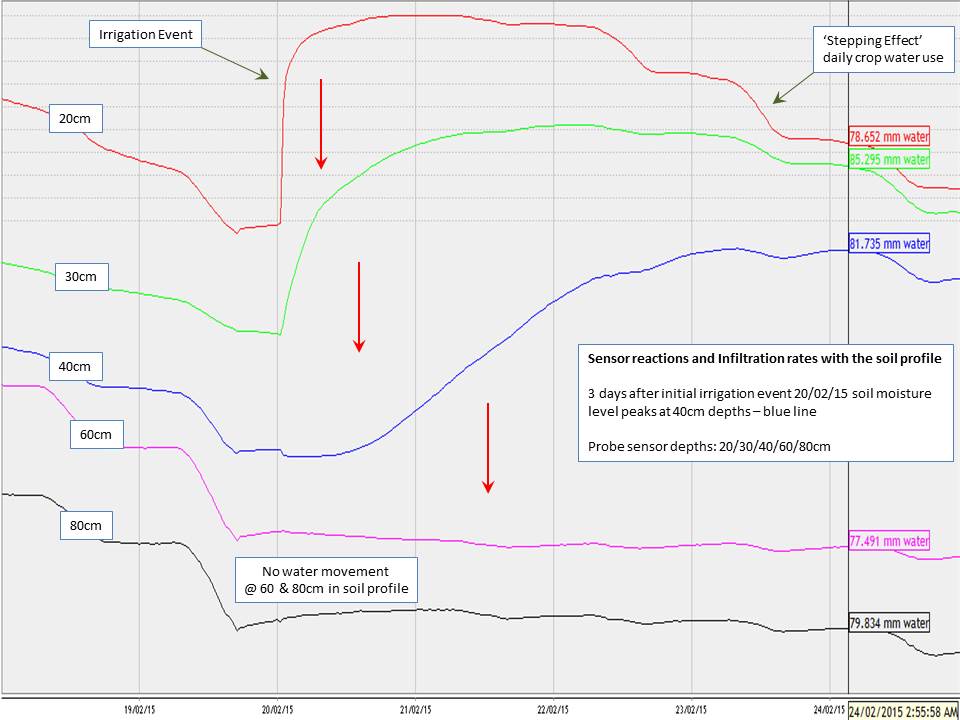
Water Infiltration Rates
|
Example Data - Water Infiltration Rates
|

Drip Irrigation Wetting Onion
|
Example Data - Drip Irrigation & Wetting Onion
|
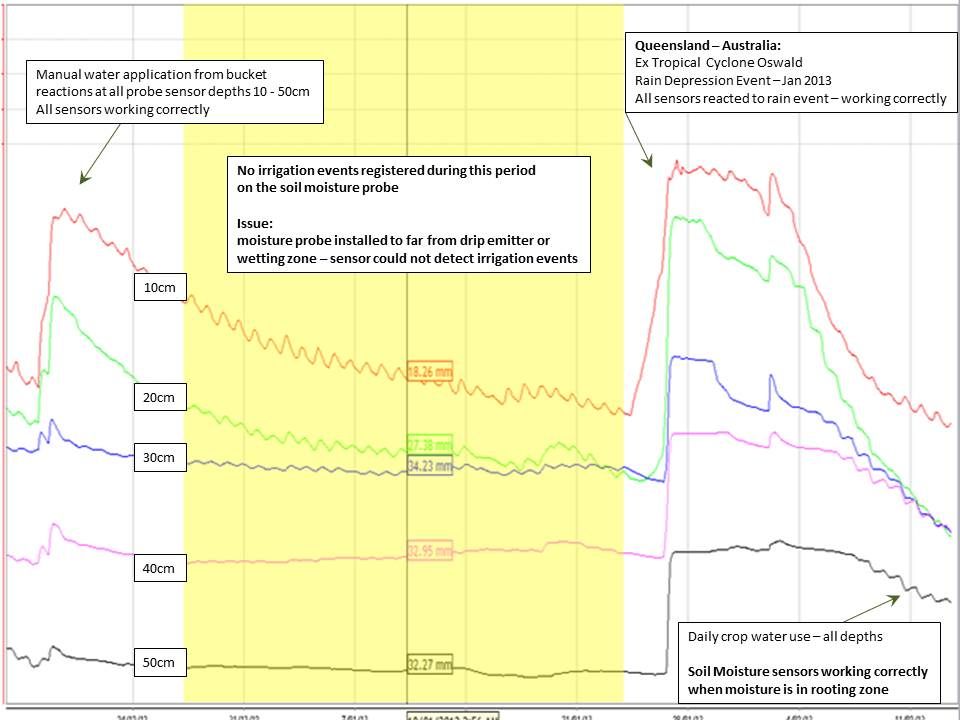
Incorrect sensor installation
|
Example Data - Drip Irrigation - Incorrect site installation & sensors installed to far away from Drip Emitter
|
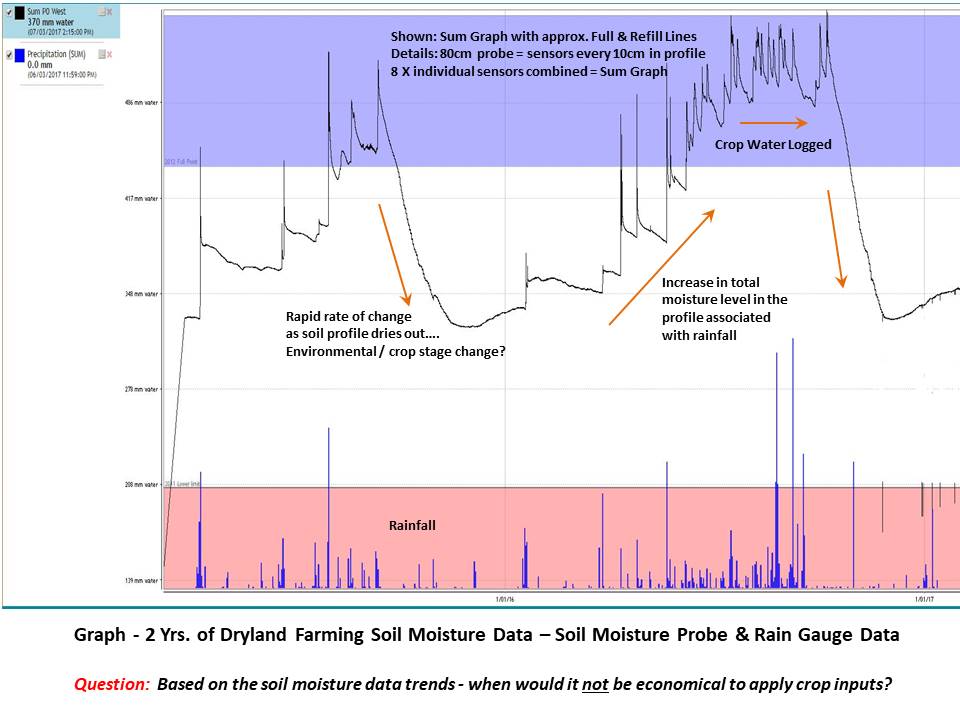
|
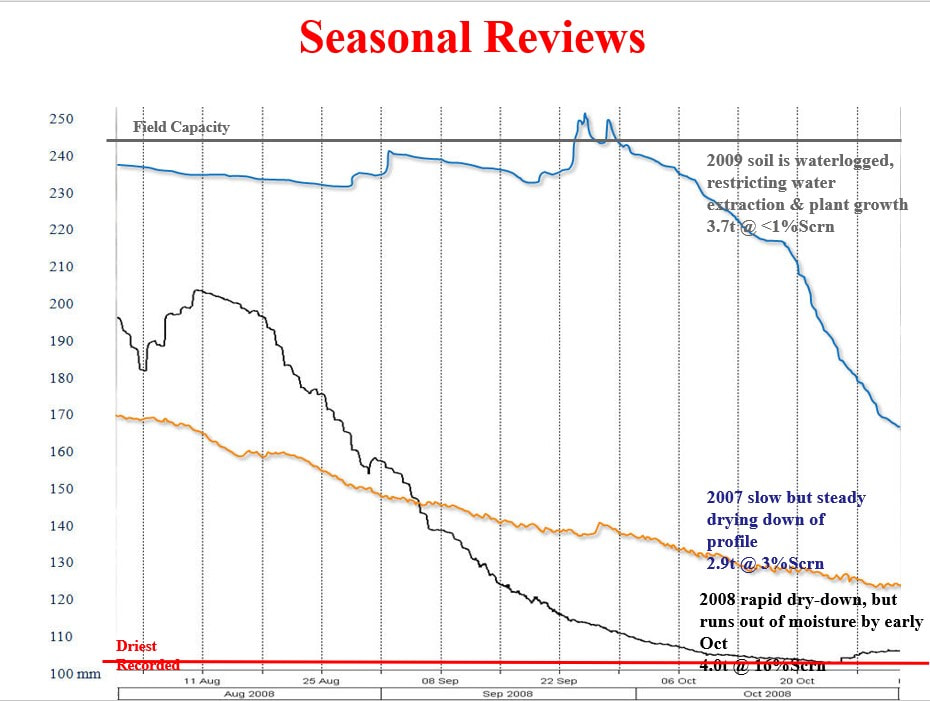
Example Data - Dryland Cropping Data & what the probe can show?
|

Over Irrigation - 'Before & After'
|
Example Data - Over Irrigation - 'Before & After'
|